Question 11
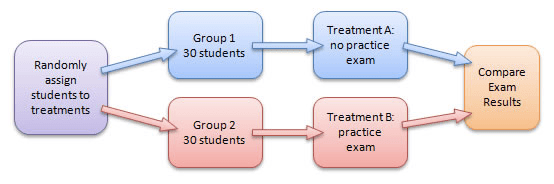
Completely Randomized Design
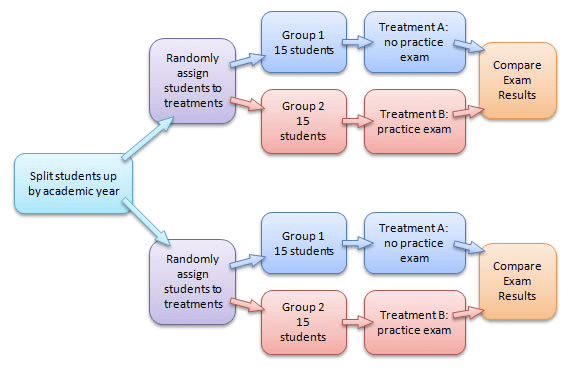
Randomized Block Design
Question 12
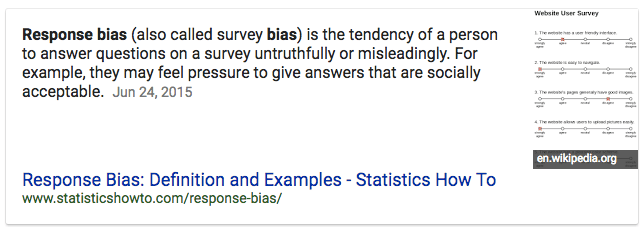
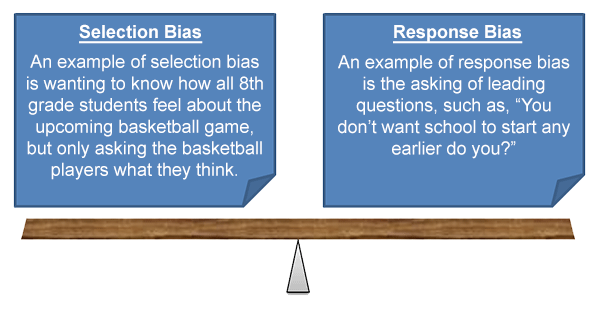
How to minimize response bias
Use Clear Language
Choose Words and Phrases With Care
Know How To Frame Your Questions
Provide Just the Right Amount of Options
Plan a Neutral Survey Structure
Keep Styling At a Minimum
Be Honest
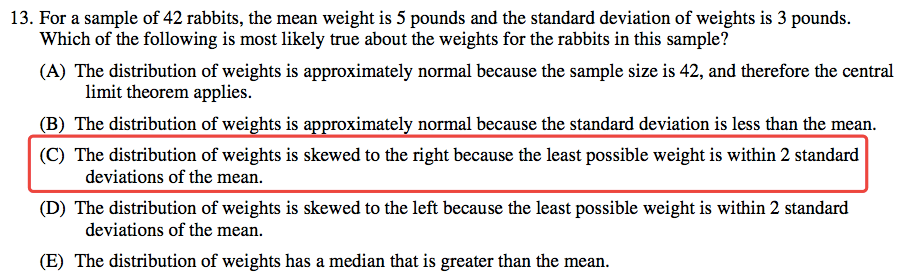
Question 13
Question 18
- Population size should be at least 10 times the sample size so that the degree of dependence among observations is negligible.
Question 22
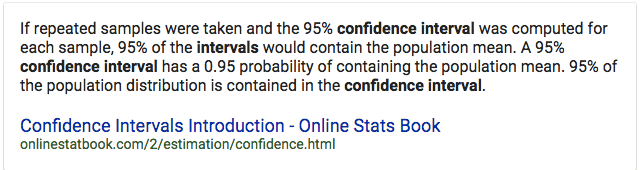
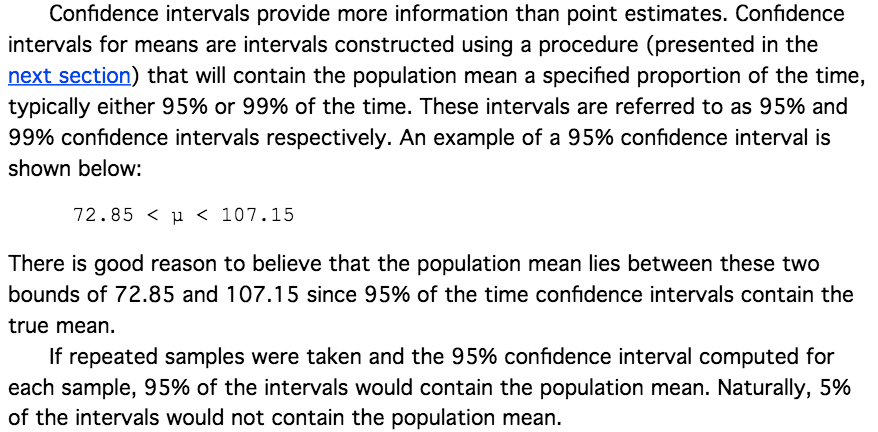
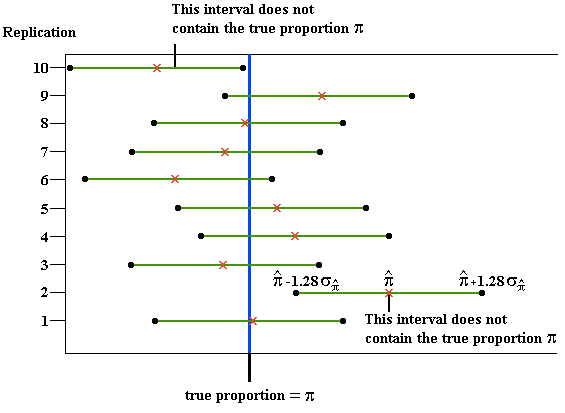
Confidence Interval Interpretation
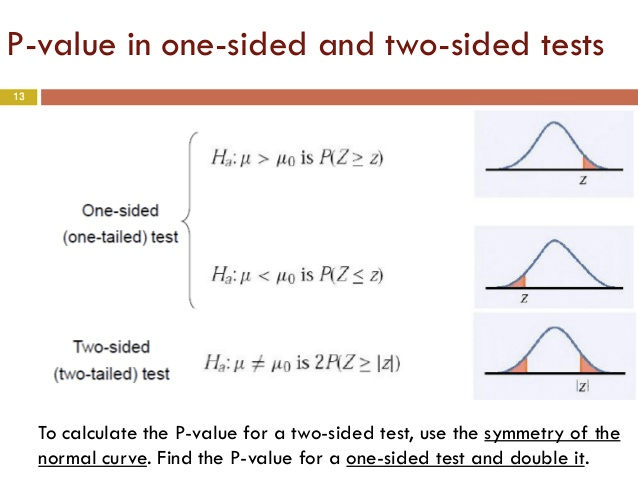
Question 28


Question 32
- SE Coef = Standard Deviation of Statistic (not population)